Product Analytics to Boost the Growth of Your Online Store

Boosting the growth of your e-commerce store is not merely about showcasing an extensive range of products or owning a visually appealing website. It's about gaining a deep understanding of your customers, of their likes, and the performance of your products. This is where the power of business intelligence and product performance data analytics comes into play, enabling you to make data-driven decisions to enhance your product offerings, boost customer satisfaction, and increase sales.
Now let's dive straight in:
1. Establish Concrete Objectives
The initial step is to set precise growth targets for your online store. Are you aiming to increase sales, boost customer retention, or broaden product categories? Having well-defined goals will steer your data analysis efforts and assist you in making data-driven decisions.
2. Select the Appropriate Product Analytics Tools
An abundance of tools are at your disposal for analyzing product performance. One standout tool is Datma, our all-inclusive business intelligence platform that can monitor and quantify key metrics such as conversion rates, product views, add-to-cart rates, and the revenue each product generates. To grow your online store, it's crucial to delve deeper into your data and Datma can be your help in this journey.
For further material on this topic, read our article here to discover how you can use product performance analytics to increase sales, cross-sell, up-sell, and boost Average Order Value (AOV).
Now that you have an analytics tool picked out, it's time for the following steps.
3. Evaluate Product Performance Metrics
Regularly observe and analyze product performance metrics. This will aid you in identifying top-performing products and those that are lagging, allowing you to modify your product lineup accordingly.
Datma helps in this aspect by providing exclusive insights into the number views, impressions, conversion rates, click through rates, and 30+ measures for each product in the catalog. Not only this, but also collection attributed measures are covered, so you can get a full view of your store performance. For more details on Datma's product analytics, view our page.
4. Segment Products
Categorize your products into groups or segments based on factors like visibility, popularity, and revenue generated. Analyzing the performance of each segment can reveal trends and growth opportunities.
For such segmentation, Datma puts at your disposal the following overview structure for your entire catalog:
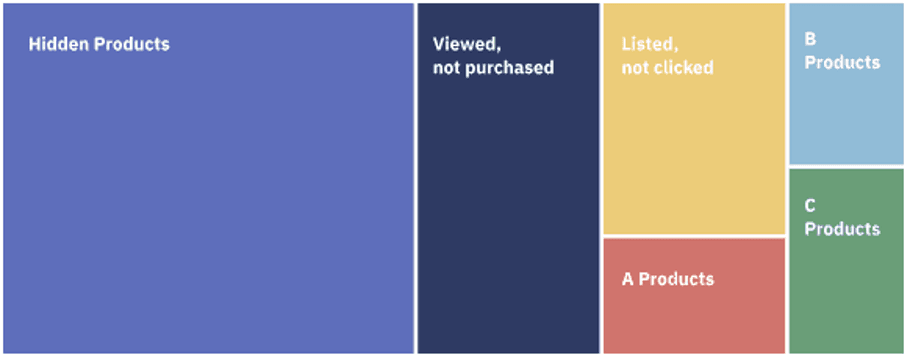
This report helps you to monitor how your products perform on the website down to the smallest detail and grouped for easier understanding.
Learn more about this report in our video here.
5. Recognize Customer Preferences
By analyzing data on trends and average daily sales, you can gain a better understanding of customer preferences and purchasing behaviors. This can guide you in tailoring your product offerings to meet customer demands.
Get an instant view with Datma's analytics directly in your dashboard for:
- Trends
| Product Title | May | April | March |
|---|---|---|---|
| Monstera | 144.50 USD | 346.50 USD | 154.50 USD |
| (Trend) | -58.3% down | 124.27% up | 0% |
Learn more about Datma's Product Trends report here.
- Daily Average Sales
| Product Title | DAS 2 days | DAS 7 days | DAS 14 days | DAS 30 days | DAS 60 days | DAS 90 days | DAS 180 days | Trending DAS |
|---|---|---|---|---|---|---|---|---|
| Curtain | 3 | 1.71 | 0.86 | 0.67 | 0.77 | 0.31 | 0.80 | 1 |
These two reports enable you to identify emerging market demands and the speed at which products are selling, so you can adapt your product offering accordingly and ensure availability of high-demand items.
6. Cross-Sell and Upsell Opportunities
Product analytics can also assist you in identifying cross-selling and upselling opportunities. By gaining insights into frequently bought together products, product types, and vendors, you can suggest related or complementary products to customers during their shopping journey. Get help in this from Datma's Frequently Bought Together report:
| Product One ID | Product Two ID | Shared Orders | Prd. One % of Shared Orders | Pr. Two % of Shared Orders | % of Store Orders |
|---|---|---|---|---|---|
| Monstera | Cactus | 4 | 50% | 33% | 15.50% |
Watch our video here to gain a deeper understanding of Datma's Frequently Bought Together product report.
*Further material for the above 2 points can be found in a related article here.
7. Inventory Management
Utilize product performance data to optimize your inventory management. Stock up on top-selling items and reduce stock levels of low-performing products to avoid overstock and understock situations.
8. Price Optimization
Price analytics can help you comprehend customers’ price preferences and establish optimal pricing strategies for your products. This can lead to increased sales and profits.
Datma helps store owners improve their pricing strategy through the Price Range Analysis and Price Change Effect reports.
- Price range analysis offers insights into how products at a specific prince range perform. More specifically, you can monitor things such as, product revenue, product margin, units sold, and many other measures. For example:
| From Price | To Price | Product Revenue | Product Margin | Units Sold |
|---|---|---|---|---|
| 11 USD | 51 USD | 366 USD | 100% | 10 |
| 51 USD | 91 USD | 826 USD | 100% | 16 |
Here, product prices ranging from 11 to 91 USD yield the same margin. However, those from 51 to 91 USD are more popular with customers and drive more revenue and sales.
By evaluating the impact of pricing on sales, revenue, and profit margins, store owners can discern the optimal price range that balances customer attraction and profitability, a vital factor in how to price a product effectively.
- Price change effect assessment enables online stores to grasp their products' price elasticity, a measure of how sensitive customer demand is to changes in price. As an example, let’s look at table below which represents product revenue at different price points:
| Product Id | Product Title | -20% | -10% | At Current Price | 10% | 20% |
|---|---|---|---|---|---|---|
| 3214567654 | Gold watches | 45 USD | 40 USD | 30 USD | 25 USD | 20 USD |
| 4445654323 | Medicine | 47 USD | 47 USD | 50 USD | 60 USD | 58 USD |
If a product is highly price elastic, like Gold watches above, a price decrease may lead to a significant increase in demand, resulting in higher overall revenue. On the other hand, if a product is inelastic, like Medicine above, a price increase may have little impact on demand, allowing store owners to maximize profitability.
With this report, you can discover pricing patterns and trends, determining if customers respond more favorably to price reductions or whether there is room to increase prices without decreasing demand.
You can read more about how you can use Datma’s reports to refine your pricing strategy here.
Or watch our videos on Price Range Analysis and Price Change Effect to have a better view at Datma's reports.
9. Personalization
Leverage data to track each ordered product and provide customers with personalized product recommendations based on their purchase history. This can not only enhance the shopping experience but also boost sales.
To help in this, use Datma to track the metrics that matter such as, but not only:
| Product ID | Order ID | Created at | Customer email | Units Sold | Product Revenue |
|---|---|---|---|---|---|
| 12345 | 67890 | 24.07.2023 20.00 | example | 3 | 83 USD |
10. Promotions and Marketing Strategies
Assess the effectiveness of promotional campaigns and marketing strategies for different products using data analytics. Focus on the strategies that generate the most sales and return on ad spend (ROAS). Monitor these with Datma by gathering all this information in a single table:
| Ad platform | Costs | Revenue | ROAS |
|---|---|---|---|
| Google Ads | 132,234 USD | 290,915 USD | 2.2 |
| Facebook Ads | 84,319 USD | 151,774 USD | 1.8 |
11. Monitor Customer Spending
Use data on Order Vaue (OV) and Average Order Value (AOV) to identify high-spending customers and nurture them with targeted marketing efforts and loyalty programs. Also, identify one-time and idle customers, then concentrate your efforts on targeted marketing to convert them into high-spenders.
Datma helps by providing insights for your:
| One Timers | Idle Clients | High Spenders |
|---|---|---|
| Customers that have placed only one order | Customers that haven't placed an order in a long time | Customers with high-value orders |
12. Continuous Improvement
Keep in mind, data analytics is a cyclical process. Regularly monitor product performance data, identify trends, and make data-driven decisions to continually enhance your product offerings and customer experience.
To grow your online store, don't just rely on gut feelings. Instead, make data-driven decisions based on key metrics provided by comprehensive business intelligence tools like Datma. This way, you'll be able to increase sales and boost revenue effectively and efficiently.