Getting Started with Datma's Analytics
Getting started with a new app can be overwhelming when you see a layout and features different from the ones you’re used to.
For this reason, we put together a short guide to help you get started with Datma’s analytics.
This guide barely scratches the surface however. There is a lot left to explore, but at least you have a starting point.
Getting started
In the following paragraphs, we’ll cover maybe the first things you notice when using Datma for the first time.
The Overview page in the dashboard, the presence of both Default & Saved Reports, and the need to connect your Facebook Ads & Google Ads.
The last point will be a quick note about the data imported from Shopify, and the data that will become available through Datma (not currently available in Shopify).
If you wish to learn more about the data provided by Datma’s analytics but not by Shopify, you can read our article on Datma's Advanced Analytics vs. Shopify's Reports.
- Overview page
- Default Reports
- Saved Reports
- Marketing integrations
- Imported data
1.Overview page
The Overview page begins with an end-of-the-month forecast, providing valuable insights into your business's future performance.
How it works: leveraging historical data, Datma's analytics generate predictions for Revenue, Units Sold, and Customers for the current month.
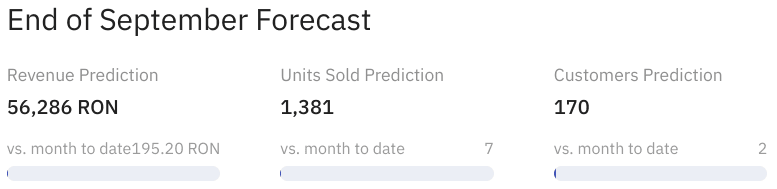
Think of it as your personal crystal ball, offering a glimpse of what lies ahead.
It's essential to note that these predictions reset on a monthly basis.
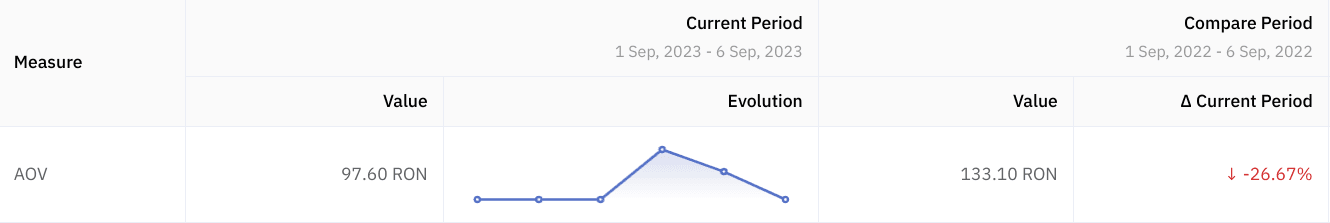
Following the forecast, the page delves into key metrics across various categories: Financials, Customers, Orders, Sessions, and Marketing.
This overview spans the Current Period (a date range chosen by you), the Compare Period (again, chosen by you), and Year-on-Year data.
It allows you to easily monitor metrics like Average Order Value (AOV), Gross Profit, Page Views, and more, tracking their evolution over time.
Pro tip:
Need quick insights into a specific product's performance?
Just type its name into the search bar, and you'll receive detailed product-specific data including an Overview, Variants, Frequently Bought Together analysis, and general information.
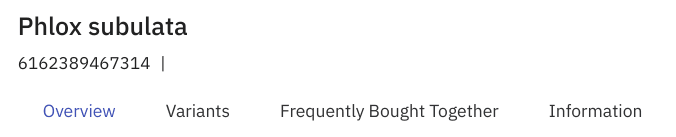
This feature is handy for quickly assessing individual product performance and can also be applied to collections.
2. Default Reports
Default Reports offer pre-set reports that grant easy access to critical insights for monitoring Products, Collections, Sessions, Orders, Customers, and Marketing integrations.
Within the Products section, Datma's analytics shine with six distinct Default Reports.
So be sure to dedicate some time for exploring your Daily Average Sales, Performance Ratios, Frequently Bought Together, Trends, and Price Analysis reports.
Even though these reports are pre-set, they can be personalized using filters.
You can also get a visual explanation of these reports on our YouTube Channel.
3. Saved Reports
Saved Reports cater to the unique goals and objectives of every business.
Datma allows you to create custom reports tailored to your specific needs, whether it's for tracking Abandoned Products, Variants, Inventory, or any other data that matters most to you.
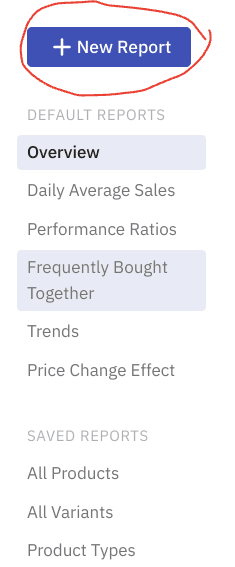
Creating a new report is easy.
Just click the 'New Report' button at the top-left of your dashboard:
Select a title and a data source:
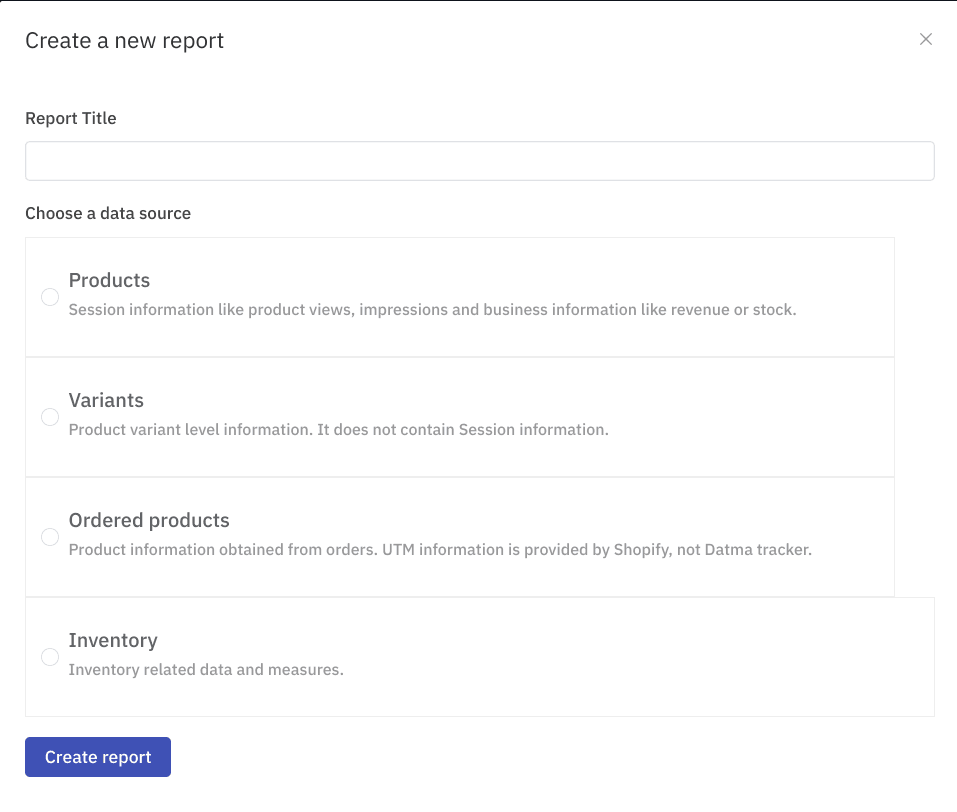
Click on ‘Create Report’.
And voila, your custom report is created. All that’s left to do is use filters to personalize it further.
4. Integrate your Google Ads and Facebook Ads
Integrating your Google Ads and Facebook Ads campaigns couldn’t be easier.
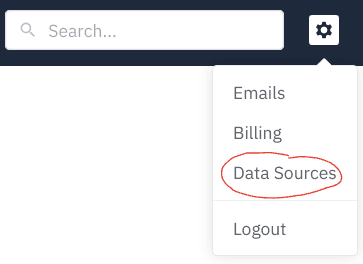
Just head to your Account Settings by clicking on the small gear icon at the top-right of your dashboard, then select 'Data Sources':
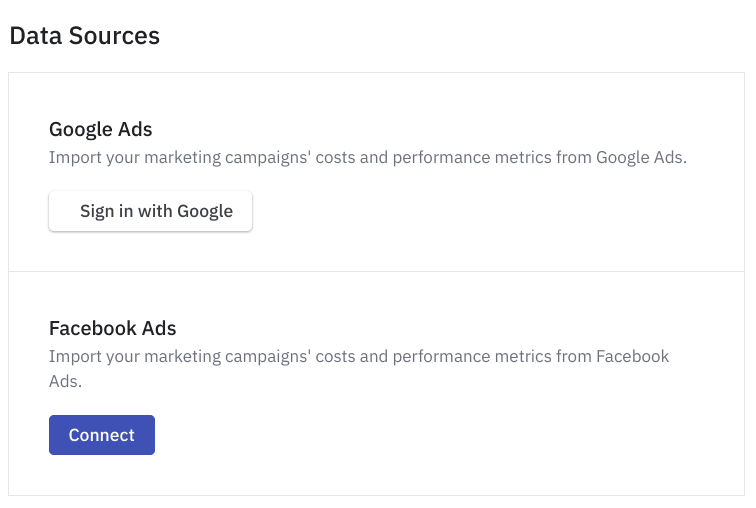
From there, simply connect your accounts to seamlessly import your marketing campaigns' costs and performance metrics:
If you ever have questions or need assistance, our team is just a click away.
You can open the chat box at the bottom-right corner of your dashboard, and one of our team members will be ready to assist you promptly.
5. Imported data
It's important to note that Datma imports two years of historical data upon installation.
However, certain data, such as PDP views (Product Detail Page views), PLP impressions (Product Listing Page impressions), and COGS (Cost of Goods Sold), is neither captured or provided by Shopify and will only become available as Datma's web script registers it.
Once Datma is installed and begins tracking your store's performance data, this missing data will gradually accumulate.
Over time, as enough data accumulates, you'll unlock exclusive insights into your product performance.
If you wish to learn more about Datma’s product analysis capabilities, you can read our other article on Product Analytics to Boost the Growth of Your Online Store
Conclusion
And that’s a wrap for getting started with Datma.
For further information, you can always refer to our website, blog, or YouTube Channel.
If you wish to receive a demo, you can register here.
For any other information, feel free to reach out at contact@datma.io and our Customer Success team will be there to assist. Don’t be shy! :)