Datma's Advanced Analytics vs. Shopify's Reports
Shopify offers a range of analytics and reports to help store owners understand and grow their online business. However, there are limitations to relying solely on Shopify's built-in analytics.
This is where Datma steps in, an advanced analytics solution that goes beyond the basics to provide comprehensive insights into your store's performance and potential.
Shopify's Analytics and Reports: A Solid Foundation
Shopify, a leading e-commerce platform, provides a range of analytics and reports to help store owners monitor their online business.
From tracking recent activity and visitor behavior to analyzing online store speed and transactions, Shopify's built-in analytics serve as an essential foundation for understanding key metrics.
However, it’s important to note here that the scope of these reports depends on your subscription plan, with advanced insights requiring an Advanced Shopify or Shopify Plus plan.
Datma's Comprehensive Approach: Beyond Shopify's Offerings
While Shopify Analytics offers a wealth of information, there are limitations to relying solely on them.
For instance, they don't provide comprehensive product-level insights spanning more than 90 days.
This is where Datma, our advanced analytics solution, comes in. Datma fills the gap in Shopify's analytics, offering a deeper dive into a store's performance and potential.
Upon installation, Datma imports two years' worth of historical data, allowing for data-driven decisions based on a more profound understanding of product performance.
This is a significant advantage over Shopify app store analytics, which may not offer such a comprehensive historical view.
With Datma's analytics, you gain access to a wealth of insights for each product, such as:
- Product performance over time
- Sales trends and patterns
- Price sensitivity analysis
- Exclusive New Insights: PDP Views and PLP Impressions
You have more than 30 measures to choose from according to your needs. A quick example is:
| Product Title | Sell through rate | Product conversation rate | Cart abandonment rate |
|---|---|---|---|
| T-shirt | 6.82% | 2.5% | 20% |
Outshining Shopify Analytics
One area where Datma outshines Shopify's analytics is in the provision of PDP (Product Detail Page) Views and PLP (Product Listing Page) Impressions insights for an improved product visibility and performance analysis.
These two metrics offer a more nuanced understanding of how visitors interact with your store.
PDP Views show how often customers view individual product pages, while PLP Impressions reveal the number of times products appear in listing pages.
A product with zero impressions in any PLP and zero PDP views means that no one knows that this product exists. No need to tell you how wasteful this is.
Whereas, a product with a high number of impressions and a low number of views means there is a lack of interest in this specific product. We know it has been seen in PLPs due to the high number of impressions, but nobody clicked on it to reach the PDP.
For more information on Datma’s product visibility analysis you can read our complementary article here.
How Can Datma Tell You What’s the Visibility of Your Products?
It’s all thanks to its proprietary web script. This combines session data with backend information, allowing it to establish a direct link between product/collection views and customer sessions.
This unique approach enables Datma to track exclusive data points, providing you with a more comprehensive understanding of customer behavior.
Filling the Void: Collection Analytics and Price Analytics
Analyze Your Shopify Collections
Datma's capabilities extend even further by offering Collection Analytics, a feature notably absent from Shopify Analytics but possible with Datma thanks to its proprietary web script mentioned earlier.
Collection analysis provides insights into how different product groups perform, helping you optimize your product assortments and marketing strategies.
As an example, Datma’s analytics provide you insights such as:
| Collection Page Views | Collection CR | Collection CTR |
|---|---|---|
| 84 | 6.8% | 45% |
You can read more about the advantages of collection analysis and the insights offered by Datma’s analytics here.
Analyze The Price of Your Shopify Products
Moreover, Datma introduces Price Analysis, a crucial tool for understanding the impact of pricing on sales and revenue, something not currently present in Shopify Analytics.
This type of analysis aids in pricing optimization by highlighting trends and customer reactions to price changes.
In this area, Datma provides two main reports: Price Range Analysis and Price Change Effect.
1. Price Range Analysis
This report enables Shopify store owners to create the most effective pricing strategy and increase sales.
Let’s look at the following table:
| From Price | To Price | Product Revenue | Product Margin | Units Sold |
|---|---|---|---|---|
| 11 USD | 51 USD | 366 USD | 100% | 10 |
| 51 USD | 91 USD | 826 USD | 100% | 16 |
In this example, product prices ranging from 11 to 91 USD yield the same margin. However, those from 51 to 91 USD are more popular with customers and drive more revenue and sales.
By evaluating the impact of pricing on sales, revenue, and profit margins, store owners can discern the optimal price range that balances customer attraction and profitability, a vital factor in how to price a product effectively.
2. Price Change Effect
This report enables Shopify store owners to grasp their products' price elasticity, a measure of how sensitive customer demand is to changes in price.
The table below represents product revenue at different price points:
| Product Id | Product Title | -20% | -10% | At Current Price | 10% | 20% |
|---|---|---|---|---|---|---|
| 3214567654 | Gold watches | 45 USD | 40 USD | 30 USD | 25 USD | 20 USD |
| 4445654323 | Medicine | 47 USD | 47 USD | 50 USD | 60 USD | 58 USD |
If a product is highly price elastic, like Gold watches above, a price decrease may lead to a significant increase in demand, resulting in higher overall revenue.
On the other hand, if a product is inelastic, like Medicine above, a price increase may have little impact on demand, allowing store owners to maximize profitability.
Through price change effect analysis, Shopify store owners can discover pricing patterns and trends, determining if customers respond more favorably to price reductions or whether there is room to increase prices without decreasing demand.
To Sum Up
By refining pricing strategies based on these data-driven insights, store owners can optimize revenue and ensure long-term business sustainability.
You can read more about Product Pricing Strategy here.
Or you check out our YouTube channel for tutorials on how to use these two reports.
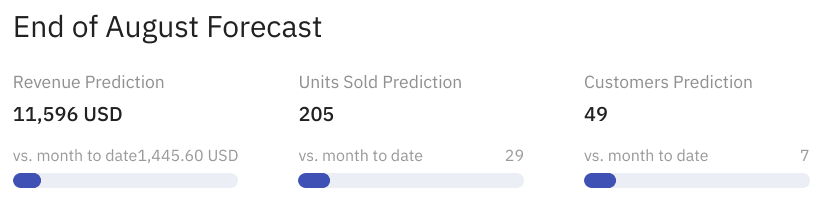
Empowering the Future: End of the Month Forecasting
Another area in which Datma outshines Shopify Analytics is in the realm of predictive analytics, with its end-of-the-month forecasts.
These forecasts empower you to predict sales, revenue, and customer metrics for the upcoming month, providing a valuable tool for planning and decision-making.
Conclusion
Shopify's built-in analytics and reports offer a solid foundation for understanding your e-commerce store's performance.
However, as the e-commerce landscape evolves, store owners need more advanced and comprehensive insights to drive growth and success.
Datma's analytics solution offers a range of features, from detailed product and collection insights and advanced metrics to price analysis and forecasting.
By supplementing Shopify's reports with Datma's advanced analytics, store owners can gain a deeper understanding of their business, make more informed decisions, and unlock new avenues for growth.